Now, let’s go back to the BSOD error first. The BSOD happens for many reasons, such as corrupt drivers, outdated firmware, and other software-related problems. So when it occurs, you will see a flash of the blue screen with an error code and several other details before Windows goes for a restart. Yes, the blue screen with the error code displayed has a purpose. These crash error details do not go away. Instead, they are saved in the Windows log so that they can be looked at and fixed later. And these logs are called memory dump files, as they are saved in the .dmp file format. Now that you know what are .dmp files, let’s understand their types.
Types of Dump Files on Windows
So, there are four types of dump files that Windows generates.
1. Complete Memory Dump
As it sounds, this memory dump records all the contents of system memory when your system hits a BSOD error. This dump contains data from the processes that were running when the memory dump was collected.
2. Kernel Memory Dump
This dump file only stores data from kernel memory, meaning it doesn’t contain data from unused or unallocated memory or any memory allocated to user-mode programs. Also, this dump file is smaller than a complete memory dump.
3. Small Memory Dump
This dump file stores the smallest amount of useful information that could help figure out what went wrong to cause the BSOD error. This file holds the Stop message and its parameters, a list of loaded drivers, and other details.
4. Automatic Memory Dump
This dump file contains the same information as a ‘Kernel Memory Dump.’ The difference between the two is not in the dump file itself but in how Windows sets the size of the system paging file. Wondering what a paging file is? A page file, also called a paging file, is used to support system crash dumps and make the physical RAM work more efficiently by moving the file’s content to a hard drive when the system’s memory is almost full. Now that you understand the types of memory dump files and the details they carry, you know how crucial BSOD or Windows crash data is. The more data, the better. And the best part is that you can change the memory dump file settings to increase the collection of details.
How to Change Memory Dump File Settings Using Windows Settings
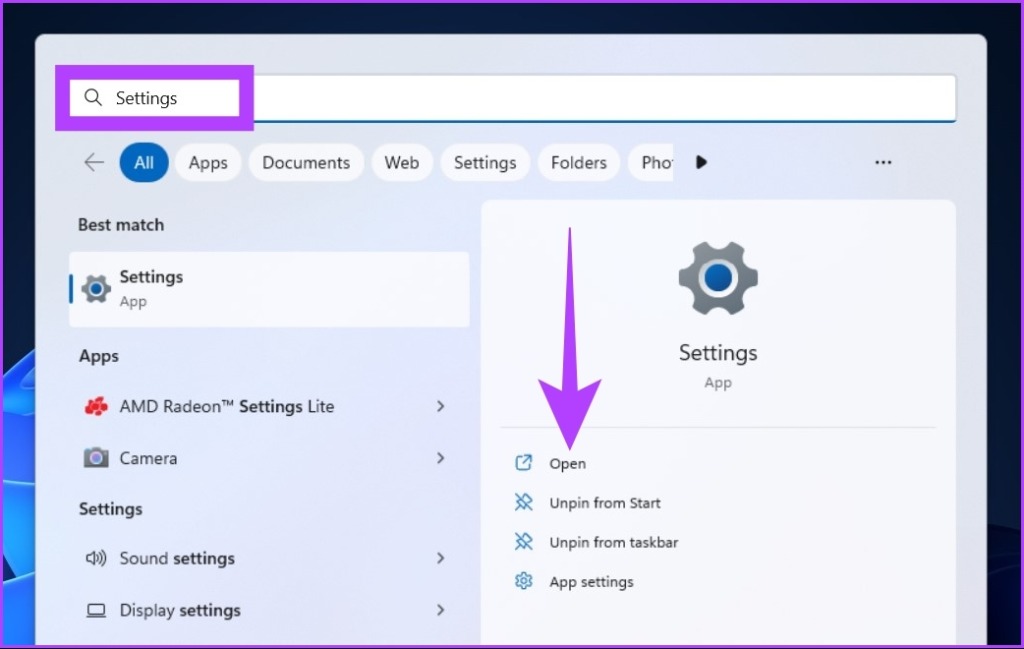
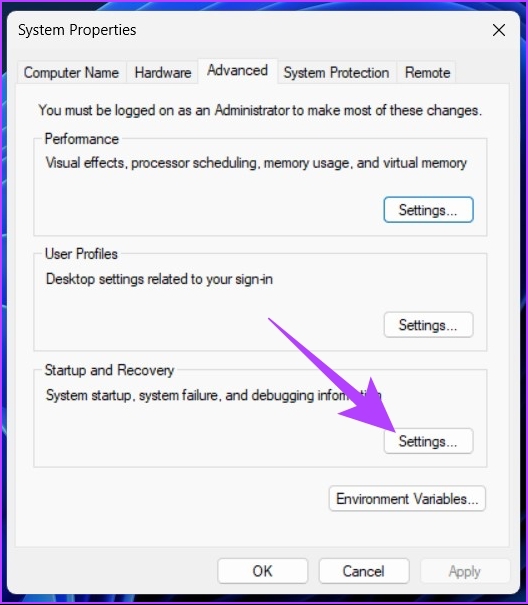
Changing Memory Dump file settings is fairly straightforward, especially using Windows Settings. Windows creates memory dump files automatically; however, you can set the level of detail. That said, let’s jump into the steps. Step 1: Press the Windows key on your keyboard, type Settings, and click on Open. Step 2: In the right pane, scroll down to About and click on it. Step 3: In the Device specifications, under the Related link, select ‘Advanced system settings’. Note: If you are on Windows 10, you will find Related settings instead of Related link, under which, select ‘Advanced system settings.’ The System Properties window will appear. Step 4: In the System Properties window, select Settings under Startup and Recovery.
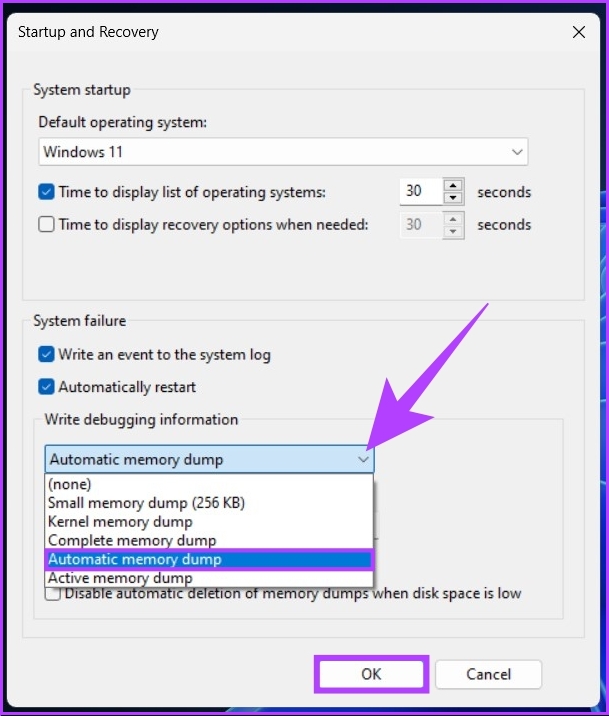
Step 5: Now, under the System failure option, click on the drop-down menu of ‘Write debugging information’ and select ‘Automatic memory dump.’ Finally, click on OK.
This setting changes the level of details collected from memory dump files when a BSOD occurs. So, that you can view and understand the cause of the error. You may need to restart your PC to implement the changes effectively. It is important to remember that this will only help BSODs that happen after you change the settings.
How to Analyze Windows Memory Dump Files
There are multiple ways you can read memory dump files and analyze them. We will use third-party applications to open, read, and analyze minidump files. Note: The methods and steps involved in analyzing the memory dump files assume that your PC is in working condition and that you can install third-party tools. If you are unable to access your PC, it is recommended that you retrieve the dump file data and analyze it elsewhere.
1. Open and Analyze .dmp Files Using WinDbg Preview
This is a Microsoft-created development tool that analyzes and resolves errors in a system. This is also one of the most recommended tools out there. Here’s how to use it: Step 1: Press the Windows key on your keyboard, type Microsoft Store, and press Enter.
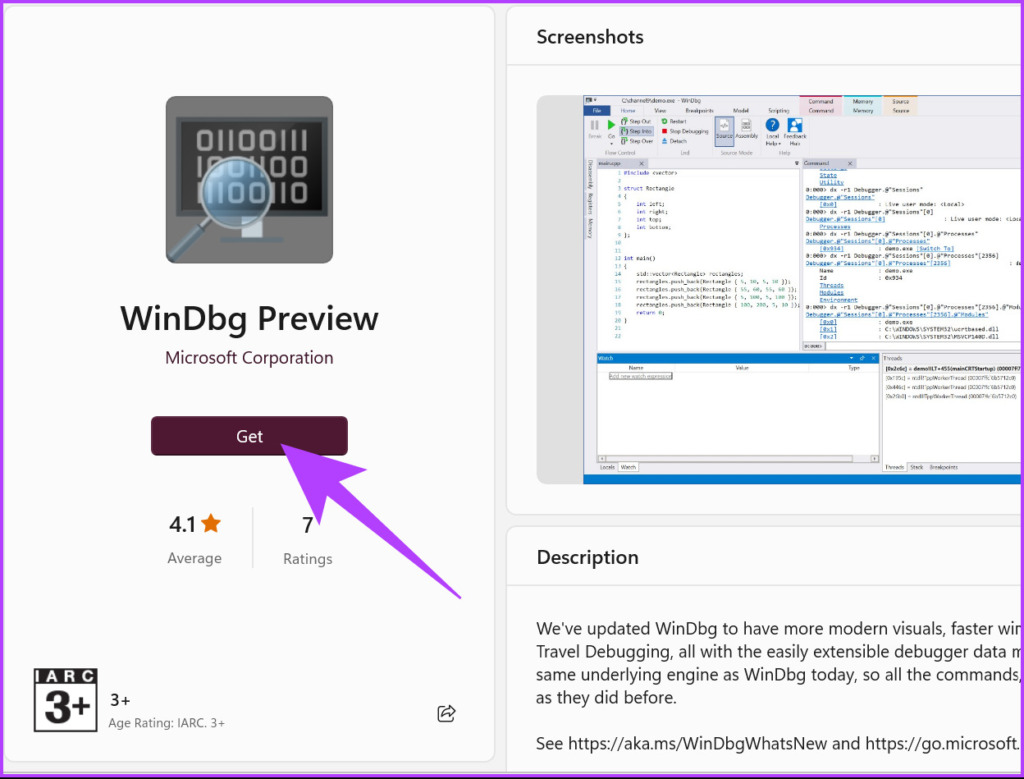
Step 2: In the search bar, type WinDbg Preview, and press Enter.
Step 3: Click on the Get button to install WinDbg Preview.
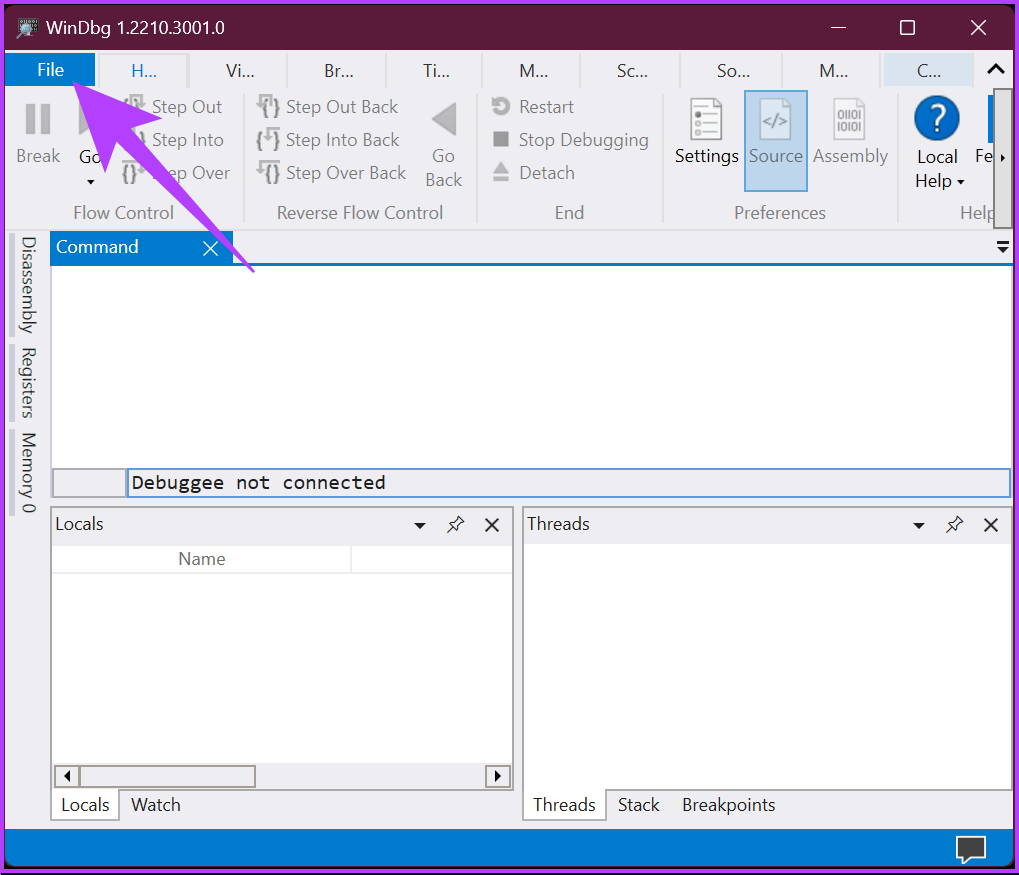
Step 4: Once installed, press the Windows key on the keyboard, type WinDbg Preview, and click on ‘Run as administrator.’ Step 5: In the WinDbg Preview Window, go to File from the top menu.
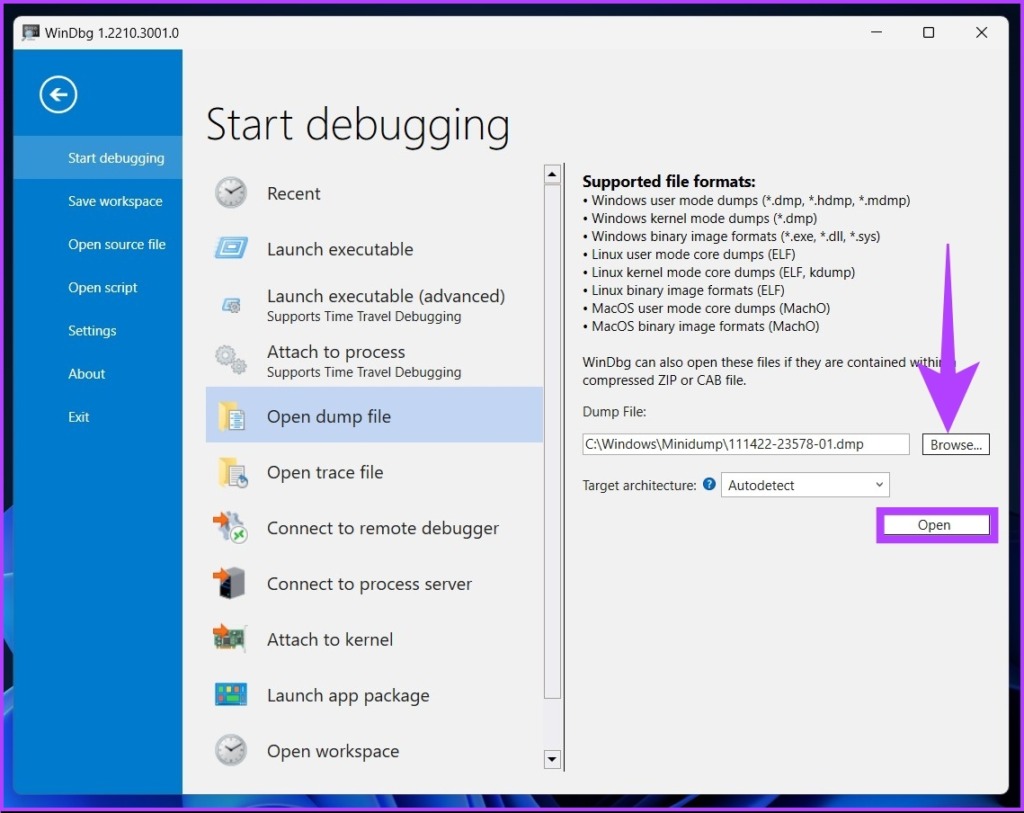
Step 6: Select Start debugging from the left pane, and select ‘Open dump file’ in the right pane.
Step 7: Browse and locate the dump file, then click on Open. Note: You can find the latest dump file in the root C:\ folder, C:\minidump, or C:\Windows\minidump folder.
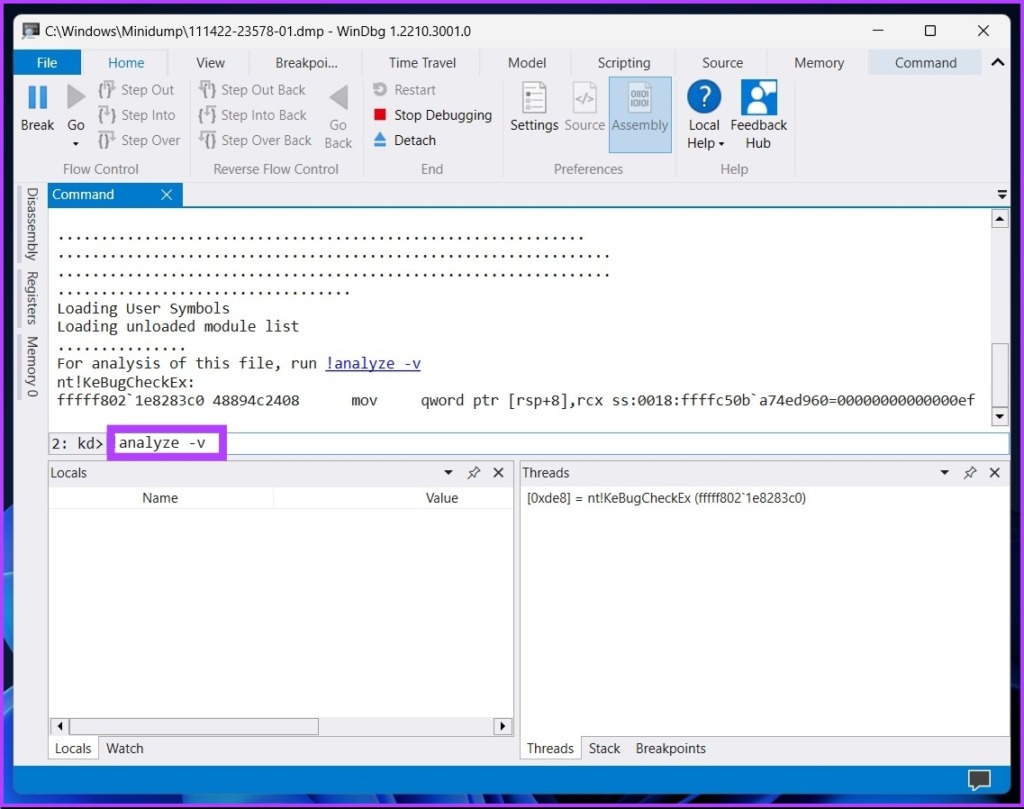
Once you open the dump file, WinDbg will load the file and run. Depending on the file size, WinDbg will take time to process. Step 8: Now, type the below command in the command tab and press Enter.
This command will start analyzing the dump file. This can take a few minutes to complete. Once it is complete, you should see the results in the top Window. With the result, you can troubleshoot the error that caused the crash.
2. How to Open and Analyze Dump Files Using BlueScreenView
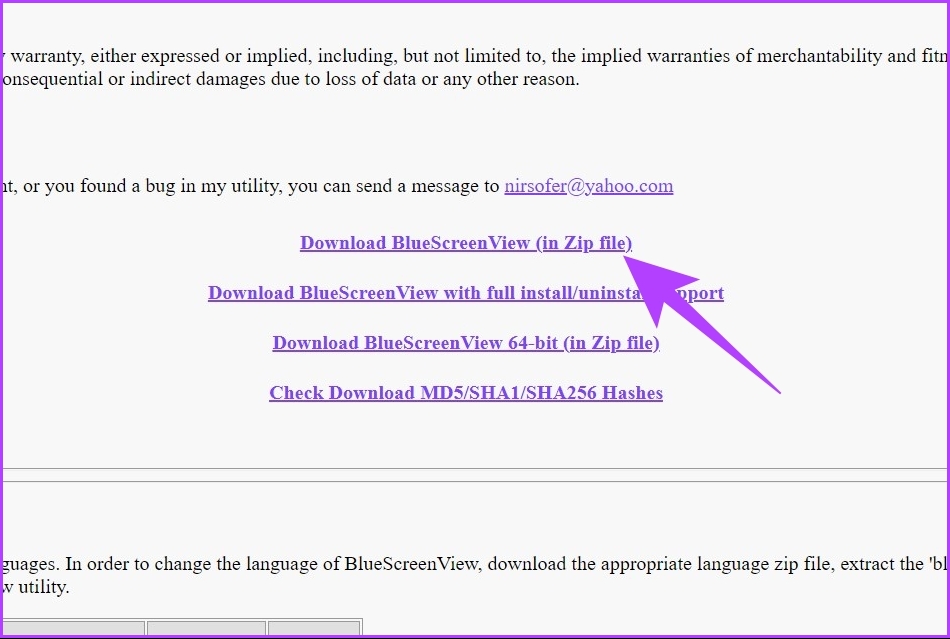
As the name implies, it scans and analyzes BSOD errors. It automatically picks up the Minidump directory dump file and processes it. Here’s how to go about installing and running this. Step 1: Download BlueScreenView using the below link, install and run it. Download BlueScreenViewer
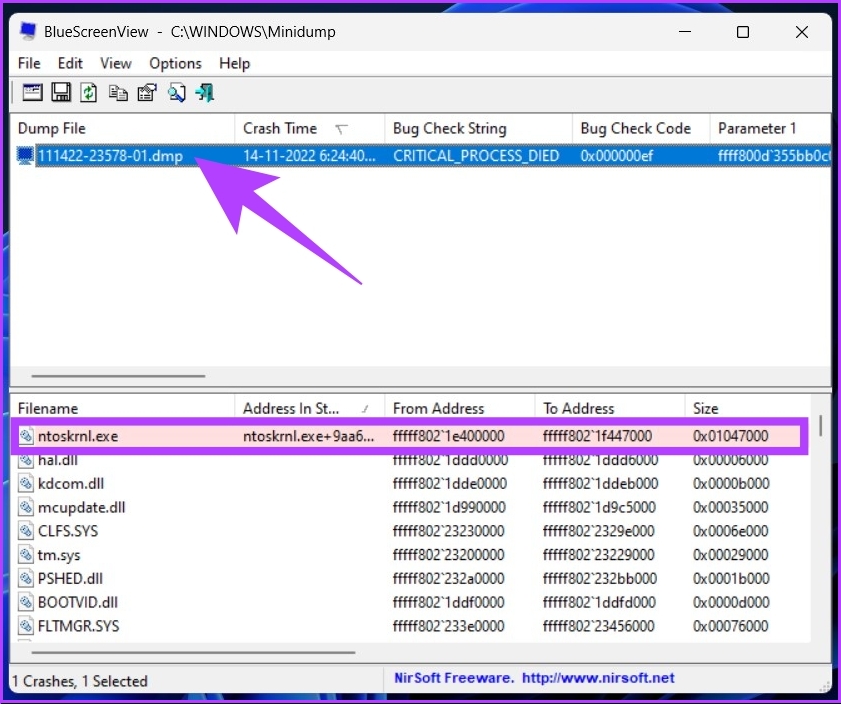
BlueScreenView auto-fetches the dump files from your system. If it didn’t, go to Options > click on Advanced Options > under the ‘Load from the following MiniDump folder’ box, click on the Browse button > click on OK. Step 2: Click on the dump files listed in the application.
The memory dump file selected will have a list of active files and drivers. The file that is highlighted in red will have the direct link to the cause of the BSOD error. You can click and troubleshoot the issue. BlueScreenView is only useful to find the error causing the BSOD, unlike WinDbg, which also lets you debug the issue. You can also checkout WhoCrashed, which we have covered extensively. It also works the same as BlueScreenViewer, which helps scan, analyze, and obtain reports on the dump files with a single click.
Troubleshoot BSOD Errors
You now know how to open, view, and analyze a dump file to tackle BSOD errors. The methods and tools involved in this article are simple and effective. We hope this article has helped you diagnose and resolve the BSOD problem once and for all. The above article may contain affiliate links which help support Guiding Tech. However, it does not affect our editorial integrity. The content remains unbiased and authentic.